The system we developed is a Java-based volleyball team optimization and game simulation tool. The application reads data from a CSV file and converts it into objects using Java classes. It calculates player performance based on weighted statistics and uses those scores to calculate an optimal lineup and simulates a match between top collegiate teams.
The dataset used for the optimal lineup consisted of Arkansas player statistics of digs, kills, errors, aces, blocks, and player names. The datasets for the game simulation contained the starting lineup statistics of digs, kills, errors, aces, blocks, and player names for Kentucky, University of Texas, Texas A&M, Wisconsin, and Penn State. The purpose of this project was to apply an optimization modeling and performance analysis, as it models real-world decisions when deciding the optimal combination in resources (players) to maximize performance. We accomplished this by utilizing OR Tools to find the optimal lineup and Math.random() to simulate a volleyball game.
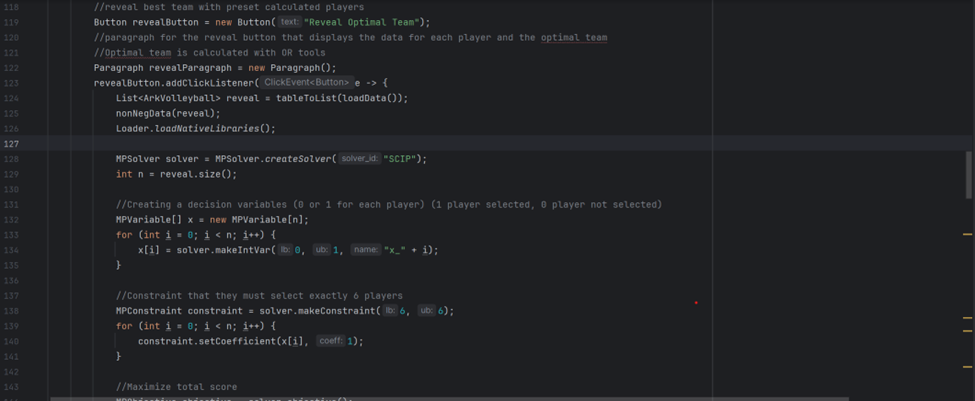
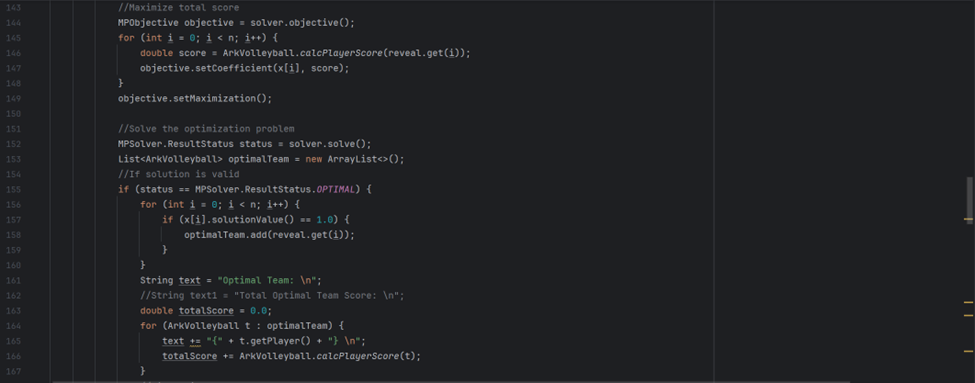
The code featured below is essential when solving for the most Optimal team. To do this we used OR Tools and solved the model with SCIP. First, we created decision variables that denote whether a player has been selected or not selected. We make a constraint that ensures users pick exactly 6 players, no more and no less. After that, we take each player’s performance score and set the objective to find a maximization to get the best possible lineup. If the solver solution is a valid solution, then we display the lineup.
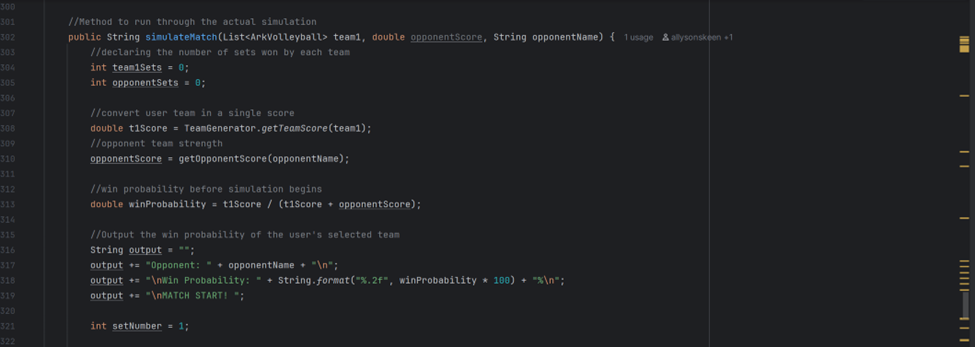
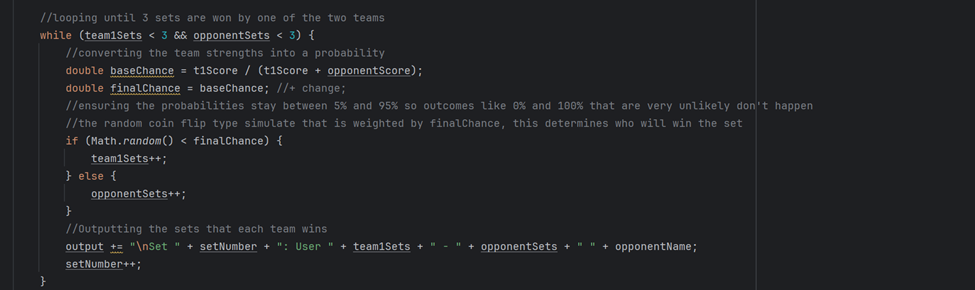
The code featured below is also essential to run a game simulation. These first lines of code calculate the user’s probability of winning before the match starts. A while loop runs until a team wins three sets, as that is when a volleyball match has been won. We start by converting the team’s score into a probability then we run through an if else loop that utilizes Math.random() to simulate the uncertainty of a match. If the team’s probability is greater than the generated value then they win the set. Once they win three sets, the loop terminates and the winner is displayed to the console.
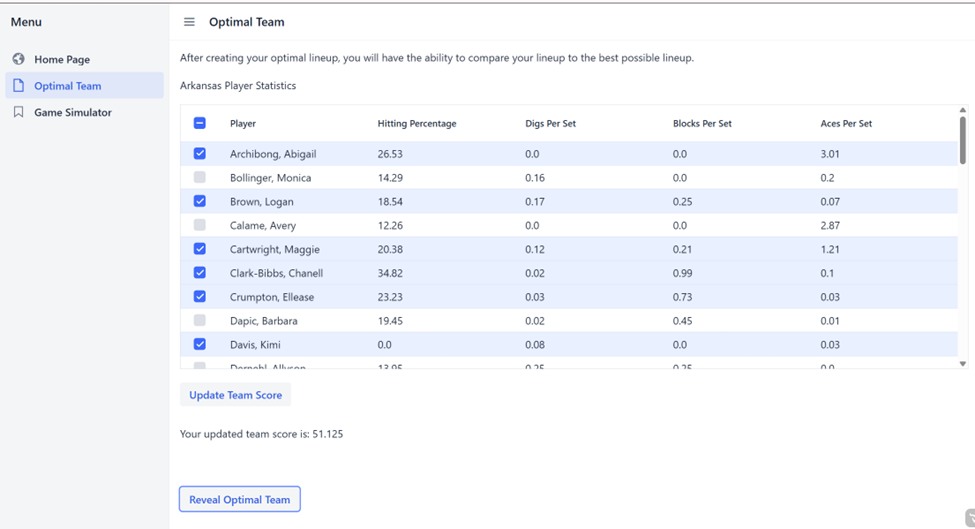
For the user interface, we utilized a multi-select grid that displays all player statistics to enhance the user experience. With this grid, we have set it so they must pick exactly six players for their optimal lineup. After selecting and pressing the “Update Team Score” button, their calculated score is output to the console. They have the option to reveal the optimal lineup that was computed using OR Tools after finishing their lineup.
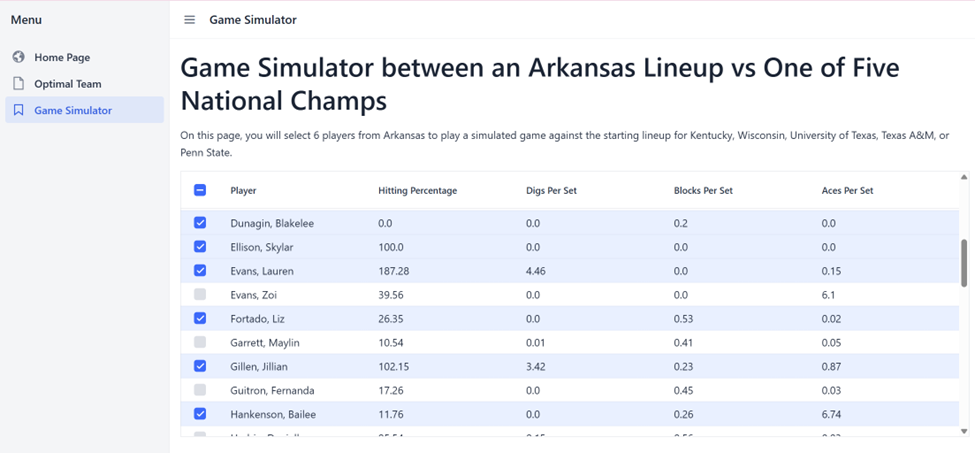
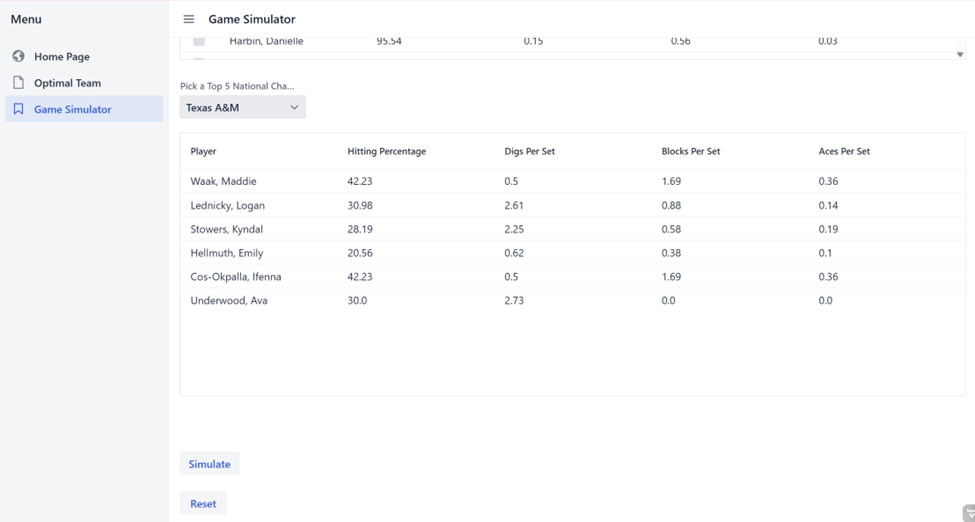
For the Game Simulator, we utilized the same multi select grid from the Optimal Lineup page. Directly under this grid is a ComboBox selection button that allows the user to pick one of the last five national volleyball championship winners which are Wisconsin, Texas A&M, University of Texas, Kentucky, and Penn State. After they make their selection, the grid is populated with the selected team’s starting lineup and statistics.
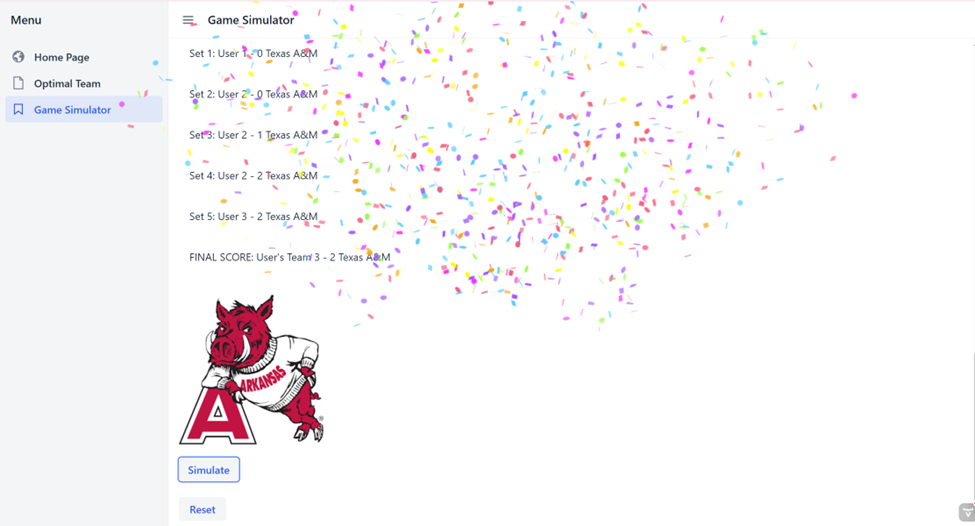
After settling on their selection, the user presses the simulate button. The output displays the user’s probability of beating the selected opposing team, the winner of each set until the game has been won, and the final score.

If the user’s lineup defeats the opposing team, then confetti fires across the screen and the mascot logo displays on the screen.
Overall, this project developed my understanding of object-oriented design. I learned how to solve a large problem by breaking it down into smaller classes to keep the flow of the code organized. This project helped expand my problem-solving skills. I learned multiple approaches to tackling challenges such as, conducting peer review, discussing ideas with teammates, and finding online resources that provide relevant information to my code. One contribution I am particularly proud of is the confetti animation that is displayed when the user wins. It’s an interactive element that enhances user experience and was something that I had never worked with before. After this project, I feel much more confident in building a user interface, working with real datasets, and implementing optimization models.